
Production Sequence Optimization
A simulation of a CNC machine that compares job-sequencing rules to trade off changeover time against lateness.
The Problem
A five-axis CNC machine makes three products. Switching between them takes a changeover of 10 to 28 minutes, while machining one job takes about 9. If jobs run in the order they arrive, about two of every three need a changeover first.
Grouping jobs by product avoids most changeovers, but an urgent job of another product may have to wait. The tradeoff is less time switching against finishing jobs by their promised time. I asked three questions:
Approach
Run times and changeover times come from a public five-axis CNC dataset (Martinez et al., Scientific Data 2025): 52,026 rows recorded once per second, with 170 machine signals and ten label columns. From the labels I rebuilt 60 events, 30 changeovers and 30 production runs. The first two experimental passes show a learning effect, so changeover averages use passes 3 to 5 only.
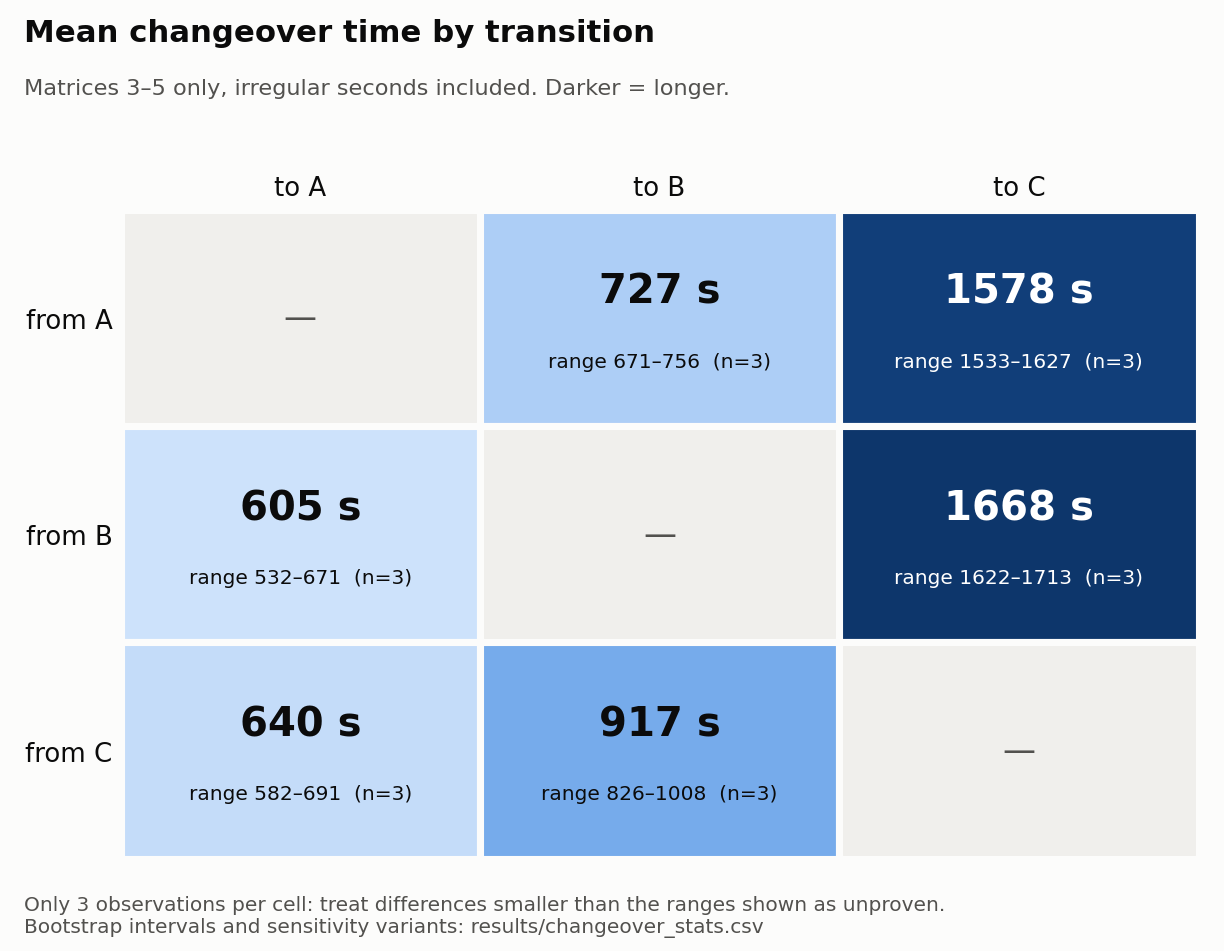
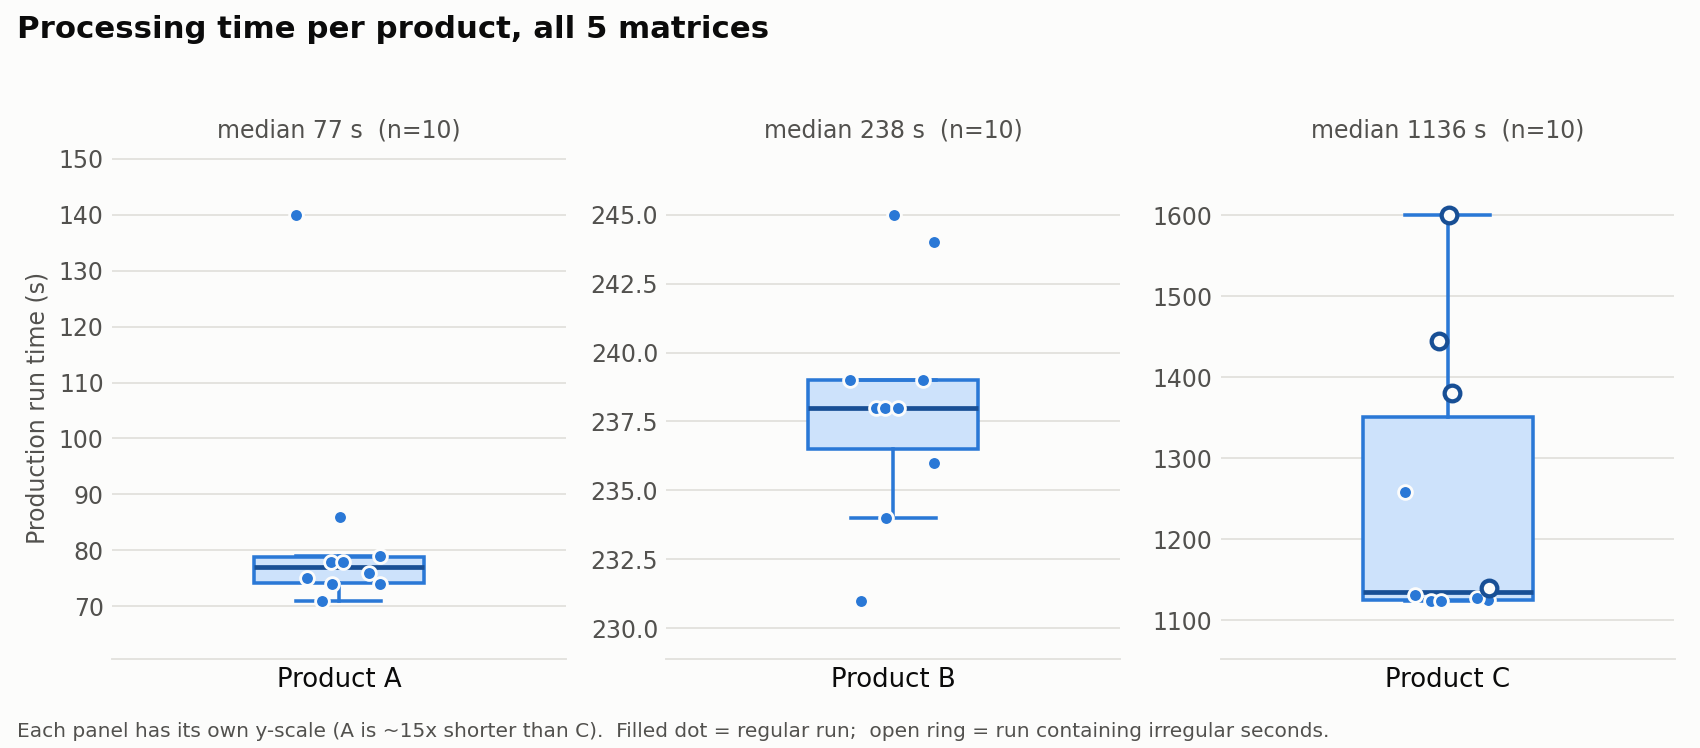
Demand is assumed, since the dataset has no order data: random arrivals at chosen loads, four product mixes, and due dates set as arrival plus run time plus a chosen amount of slack.
A discrete-event simulation of one machine, written with SimPy. Jobs arrive, get a due date, and the machine picks the next one using a rule. If the product changes, a changeover time is drawn from the real observed changeovers for that switch. Each scenario runs 30 times over 40 simulated hours, with every rule seeing the same jobs, so results come with 95% confidence intervals.
| Rule | How it picks | Main weakness |
|---|---|---|
| First come, first served | The job that has waited longest | Ignores product, so about 2 of 3 jobs trigger a changeover |
| Earliest due date | The job whose due date is soonest | Also ignores product |
| Grouped | Stay on the current product while any is waiting; switch only when none is left | Can make an urgent job of another product wait |
| OR-Tools planner | Find the lowest-score order of the 30 most urgent jobs, run the first, re-plan | More complex; depends on a tuning dial |
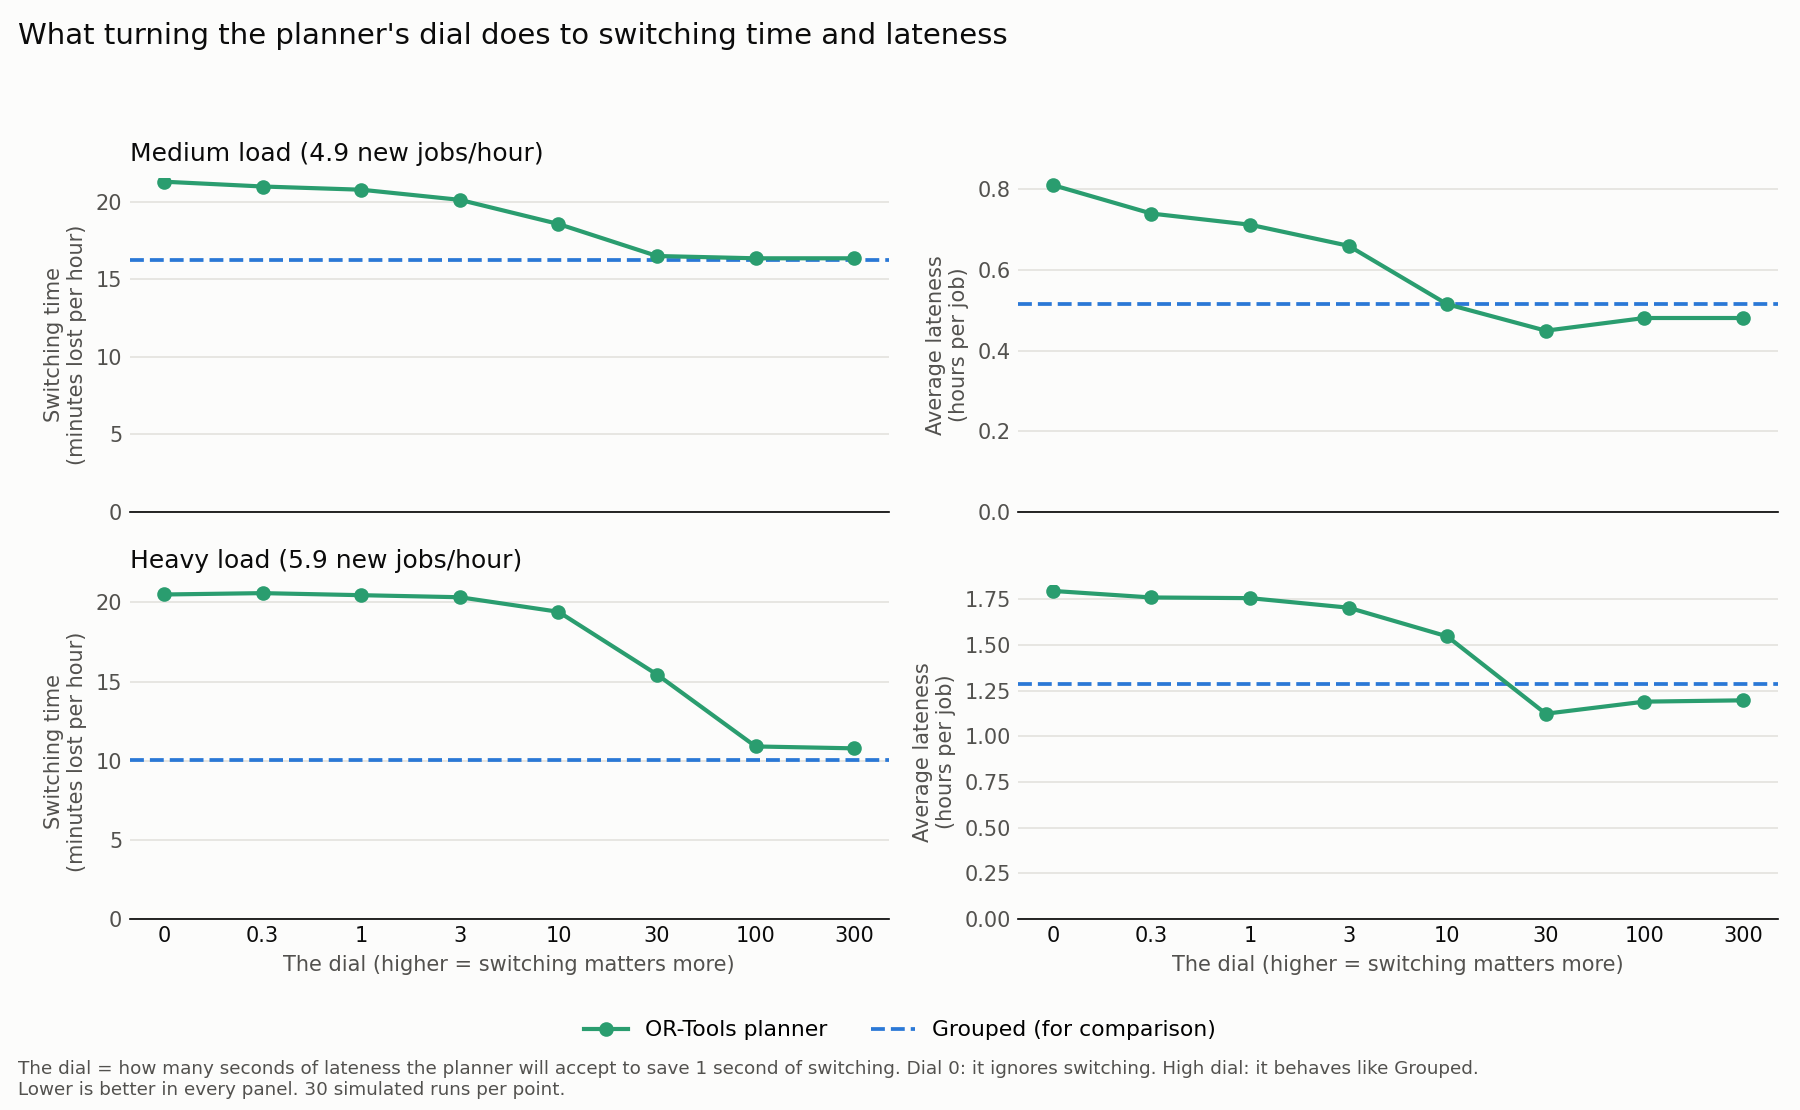
The planner scores an order by total lateness plus a dial times total changeover seconds. The full OR-Tools CP-SAT model was too slow for hundreds of runs, so the experiments use a fast version that was within 0.7% of the true best order on 60 test queues.
Outcome
Staying on one product wins at every load that matters. Each number below is the average of 30 runs on an even product mix with about 80 minutes of slack.
| Load (jobs/hour) | Changeover, min/h: FCFS / Grouped / Planner | Avg lateness, h/job (share late) |
|---|---|---|
| Light (3.6) | 34 / 22 / 22 | 3.46 (90%) / 0.12 (16%) / 0.11 (16%) |
| Medium (4.9) | 34 / 16 / 17 | 7.14 (95%) / 0.51 (38%) / 0.45 (37%) |
| Heavy (5.9) | 34 / 10 / 15 | 9.16 (95%) / 1.29 (56%) / 1.12 (51%) |
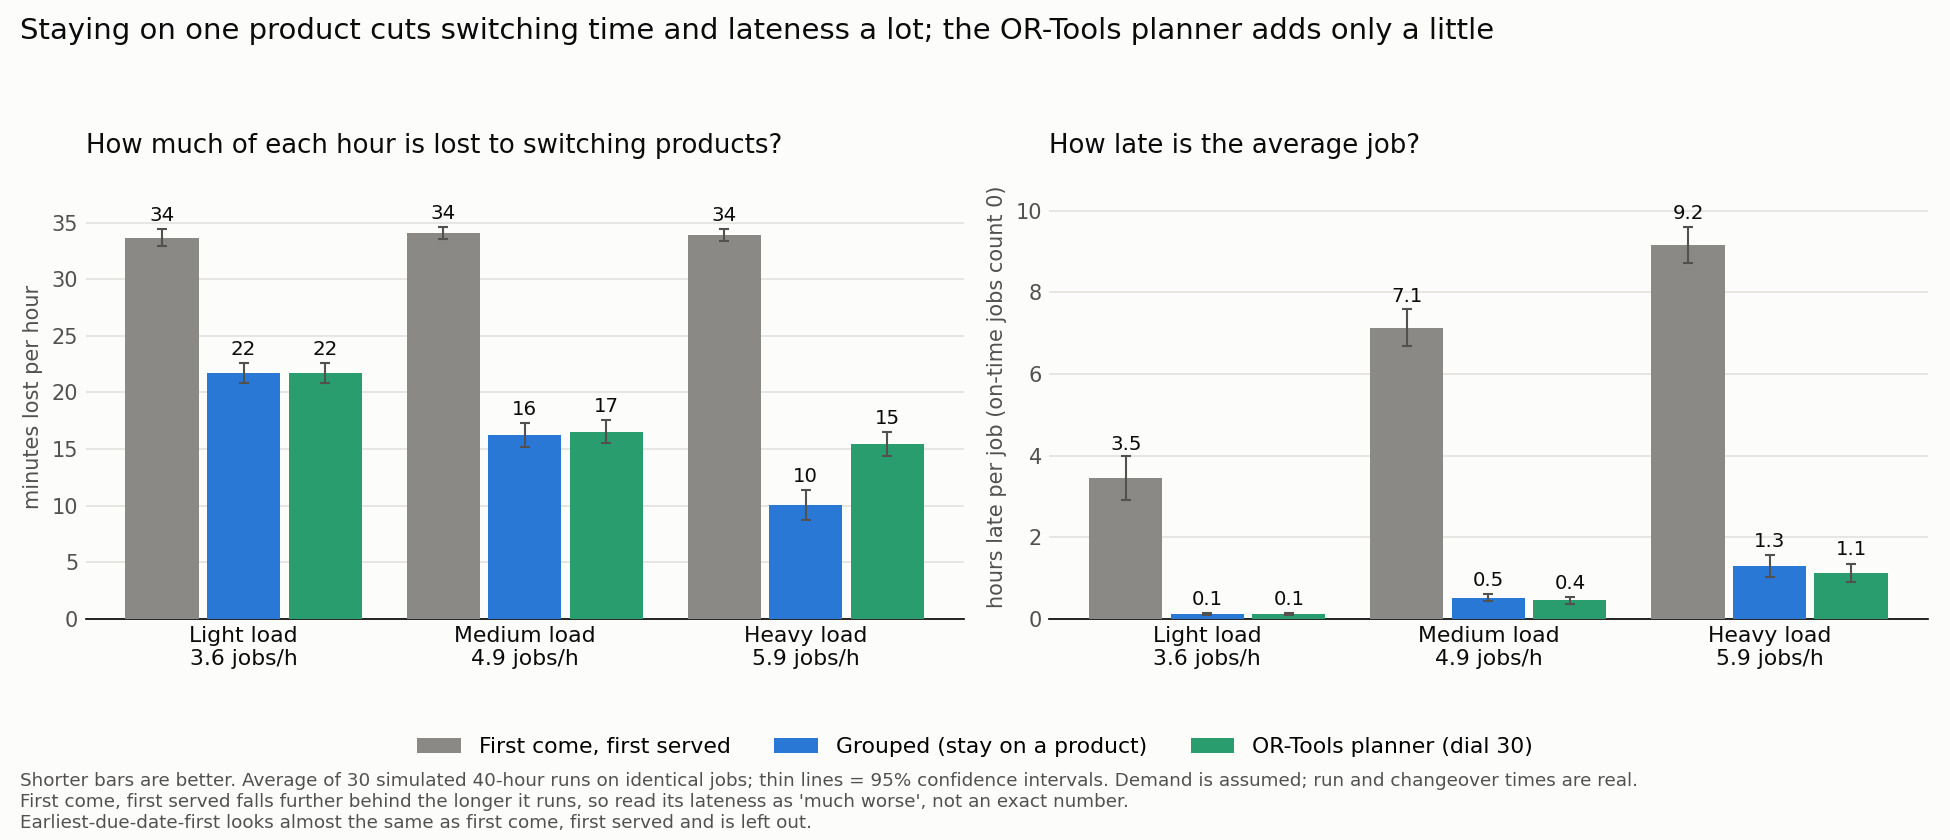
The OR-Tools planner adds only a little. Against Grouped it saves about 4 minutes of lateness per job at medium load and about 10 at heavy load. A low dial hurts, because the planner underestimates that every changeover also costs capacity for future jobs.
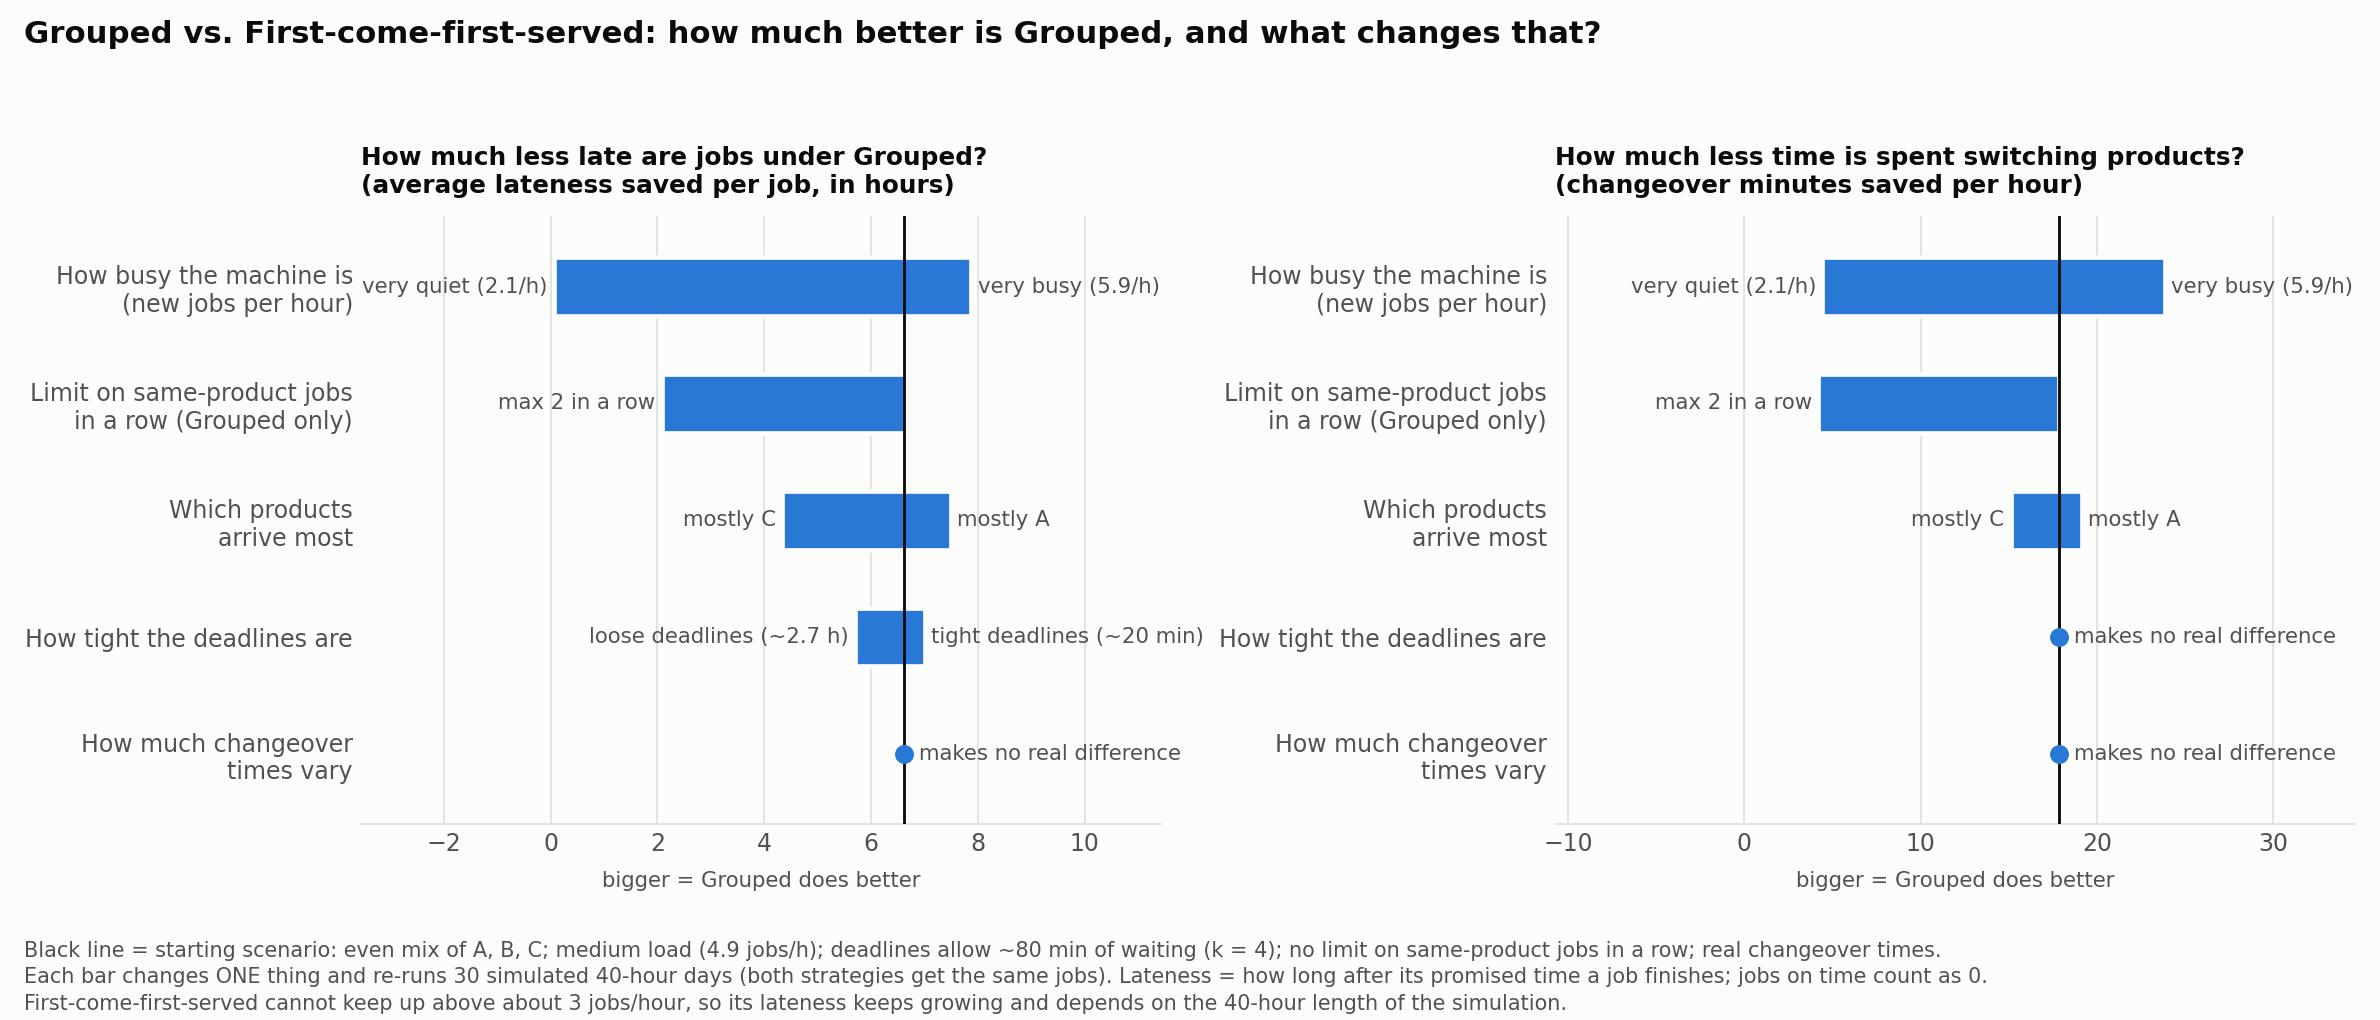
What changes the size of Grouped’s advantage. Load matters most, capping same-product runs hurts, and product mix matters. Changeover variability makes no real difference.
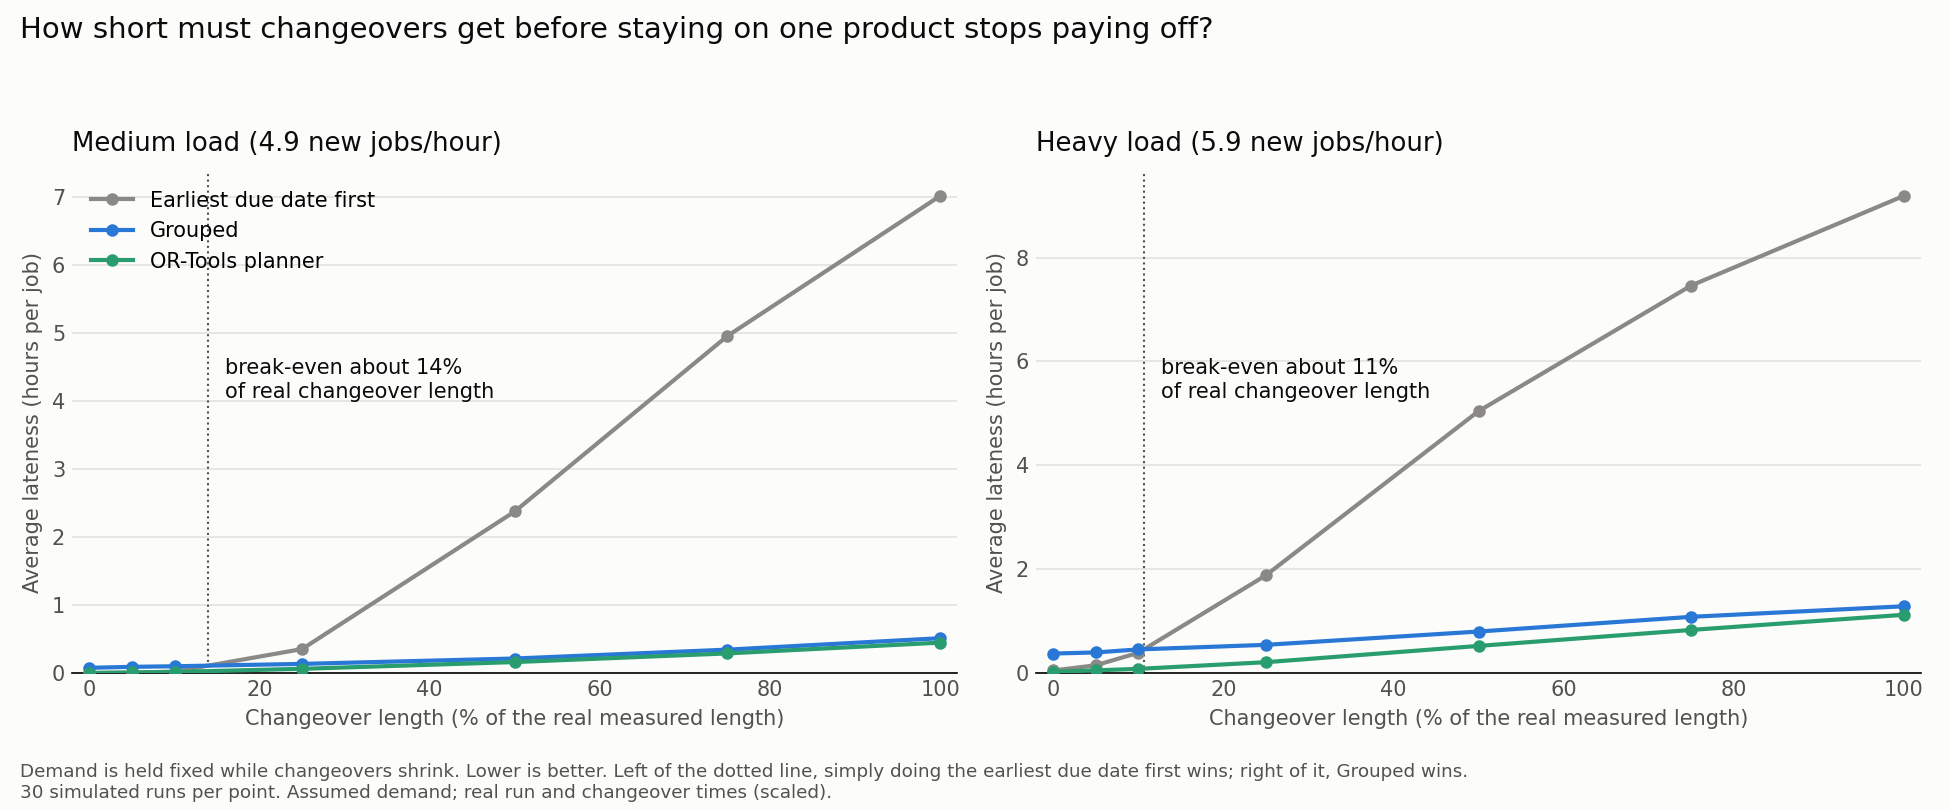
Break-even changeover length. Grouping stops paying off only when changeovers shrink to roughly 11% to 14% of their real length, about 1.5 minutes.
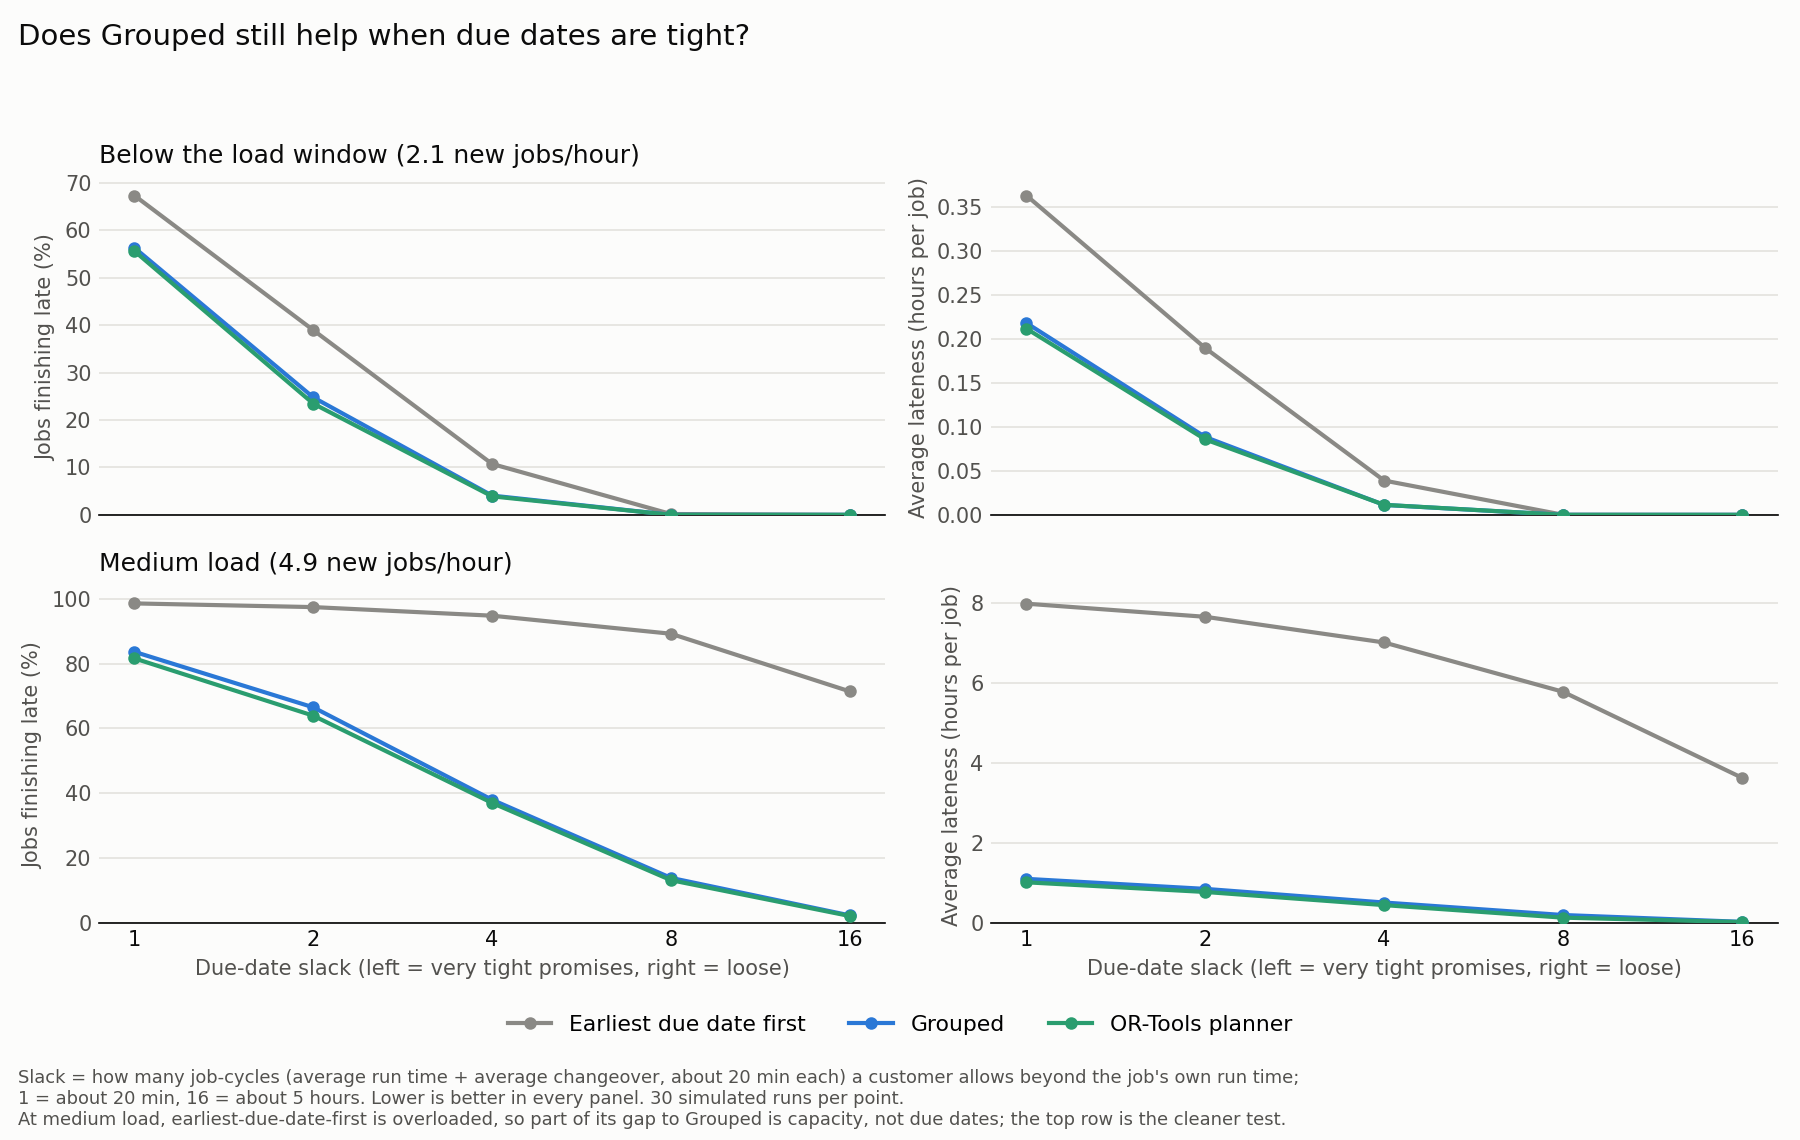
Tight due dates. No sequencing rule can rescue a promise shorter than one changeover: with 20 minutes of slack, more than half the jobs are late even on a quiet machine.
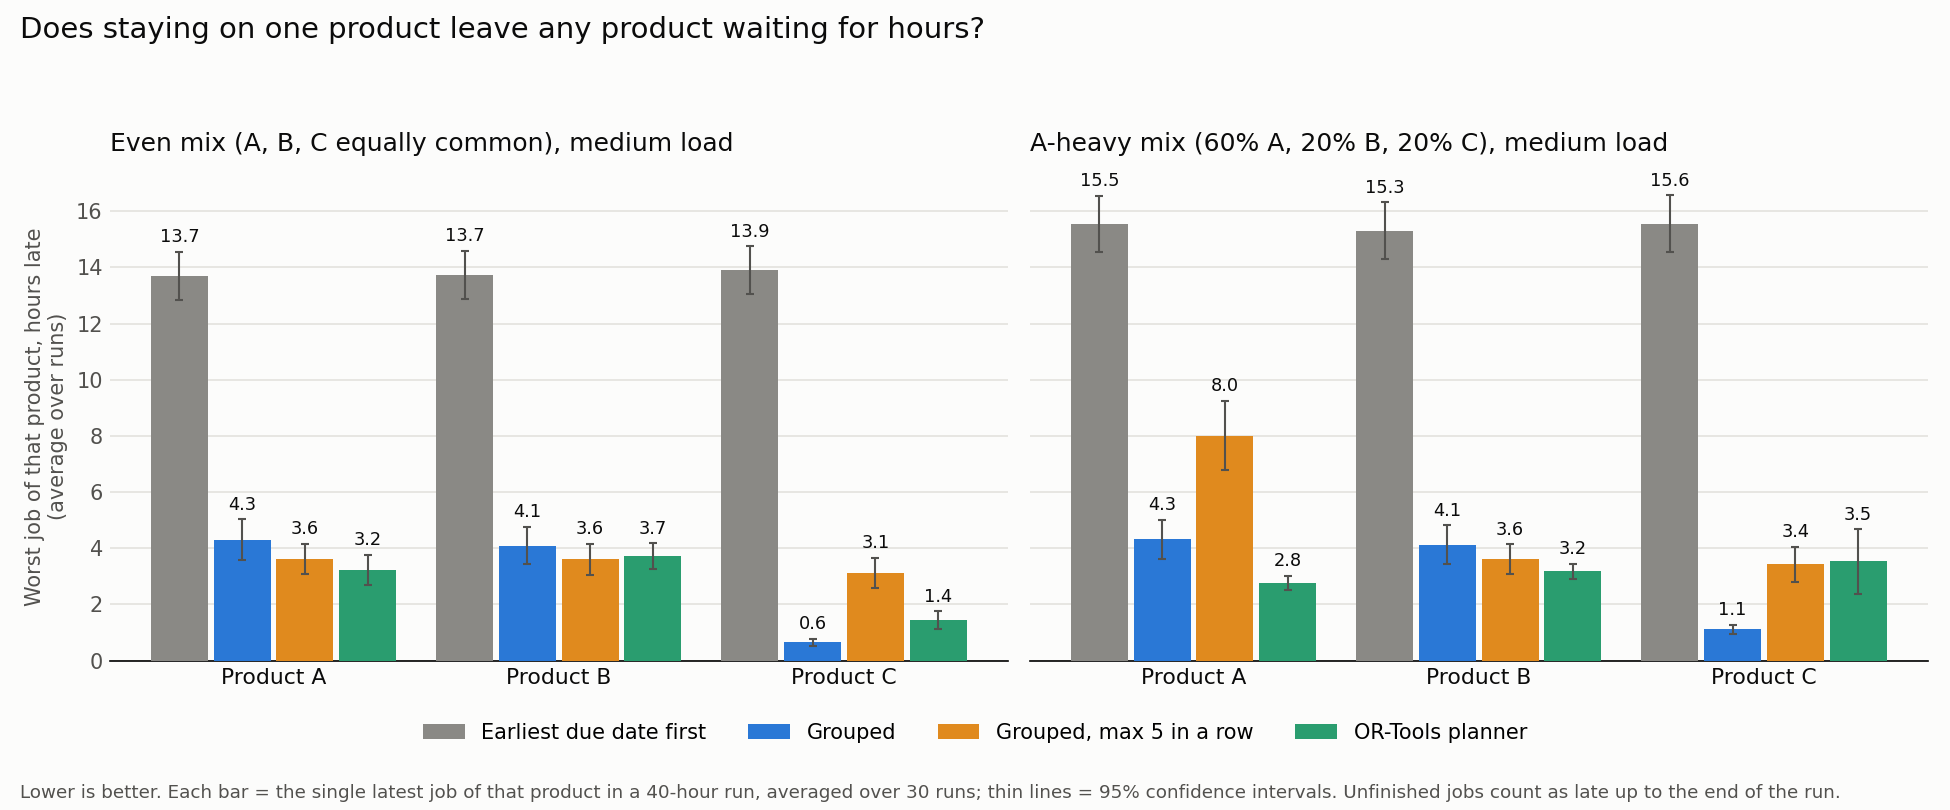
Starvation. Grouping did not leave any product waiting for hours. Its worst job per product was about 4 hours late, against about 14 hours under earliest due date first.
Run times and changeover times are real; demand is assumed. The results compare scheduling rules and do not describe any real plant.
Personal Takeaways
Almost all of the benefit came from grouping by product, not from optimization. The solver only added a few minutes per job on top of a rule anyone on the floor could follow.
Run times and changeovers came from real data, but demand had to be assumed. Labelling every input as real or assumed kept the conclusions honest about what they can and can’t say.
Hand-worked cases, Little’s law and a brute-force check on the planner caught mistakes before they reached the results, so I could trust the comparisons.