Approach
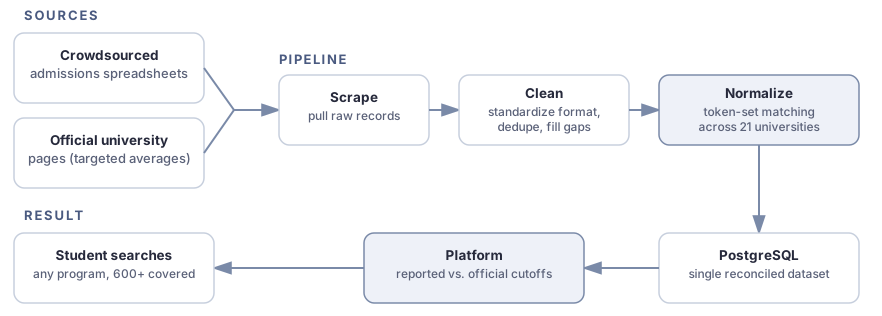
The underlying data was sourced from two places: crowdsourced admissions spreadsheets, which track real self-reported admission results and feed the core data and visualizations, and official university pages, which publish targeted averages representing each program’s estimated minimum cutoff. These served as a benchmark, allowing the platform to show how far official estimates were from actual admitted grades. Both sources came in inconsistent formats with no shared structure across schools or years. Before any analytics could be built, this raw data had to be reconciled into a single consistent dataset and cross-referenced, so the platform could show reported admission averages alongside official published ranges.
The pipeline runs in three stages, scrape, clean, and normalize:
Key Challenge: Program Matching Accuracy
The hardest problem was matching the data correctly. The same program could appear under different names depending on the source:
- Flipped word order (e.g. “Computer Engineering” vs. “Engineering, Computer”)
- Abbreviations or added specializations
- Inconsistent formatting
- Missing codes, missing names, or misspellings
An exact string match against a canonical program list only worked about 75% of the time, dropping or mismatching a quarter of the data.
To fix this, program and university names were normalized and broken into word tokens, then matched using token-set similarity.
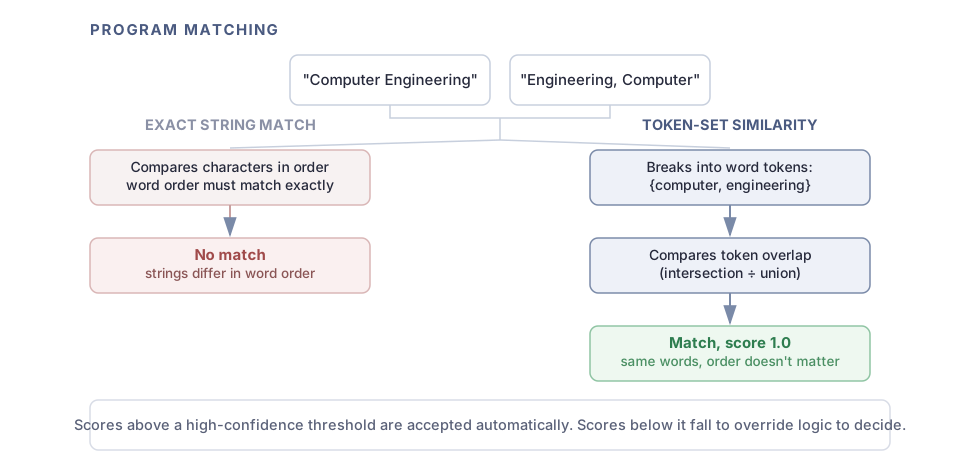
This process raised match accuracy from 75% to 95%.